

Product 01
Operational records
A geotagged field log, linked to each lot's geometry and its history.
We read multispectral imagery over time to reveal the patterns in your crop and show which zone needs attention, and when.

Crops change every day, yet they're still managed with partial information: occasional walk-throughs, isolated samples and decisions by eye. By the time a problem is visible from the ground, the diagnosis is almost always late.
Water, nutrient or disease stress shows up in the data long before it's visible to the eye.
Without a map of the lot, every input is applied evenly over an uneven reality.
Most decisions start from scratch, with no comparable history or with scattered data.
We bring data capture, multispectral processing and cloud analytics together in one place. We don't deliver images: we deliver readings, translated into control zones, alerts and comparisons you can act on in the field.
Drones, sensors and computer vision collect high-resolution information.
Vegetation indices and spectral analysis that reveal what the eye can't see.
Every lot always available and comparable with its own history.
Patterns turned into decisions: where to look, what to apply and when.
A geotagged field log, linked to each lot's geometry and its history.
Multispectral imagery calibrated to reflectance; NDVI, NDRE, GNDVI, OSAVI and comparable time series.
Models for stress detection, zoning and in-field variability, trained on real data.
We schedule a first high-precision, georeferenced survey. Camera-equipped drones record every lot and build the baseline for time-series analysis.
We turn every capture into vegetation indices and analysis layers, ready on the platform with 24/7 access.
We detect zones, anomalies and trends against the history. Your team draws control zones as polygons that persist over time and keep their notes.
You get a clear reading: where to focus, how to act, in what order and with what evidence behind it.
Your crop changes every day. So does your reading.
Continuous data, not one-off photos.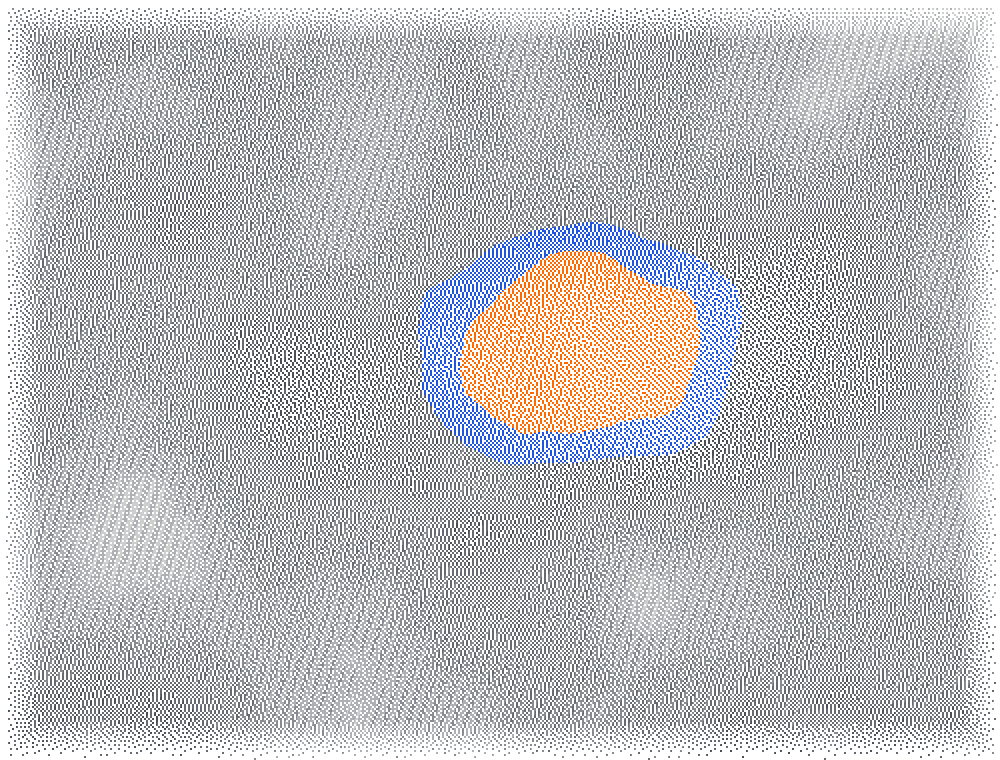

Drag to move through the weeks
Vigor, canopy cover and plant stress beyond the visible spectrum.
Underperforming areas identified more easily.
Every capture, cycle and lot, measured against its own history.
Inputs and field walks directed where they actually make a difference.
NDVI, NDRE, GNDVI and OSAVI, comparable across dates.
Every capture adds to the history, with trends by zone.
Automatic delineation, the basis for variable-rate application.
A geotagged digital log of what happens in the field.
Vigor and water-stress anomalies before they're visible.
Cloud data with continuous backup and a protected history.
Monitoring is scheduled by crop stage, from monthly up to weekly at critical moments. We agree on the cadence with you, and every survey is comparable with the lot's history.
When the core platform isn't enough, we go further: analytics projects tailored to each client's crop, operations and goals.
Plant counts, vigor-based zoning and stress detection against hydrology.
Broccoli, Ecuador — irrigation redesigned with multispectral data and topography.
Yield forecasting, optimal harvest timing and early alerts.
Broccoli, Ecuador — harvest-timing models for export.
Variable-rate application maps, zone prioritization and soil sampling.
Hearts of palm, Ecuador — spectral zoning to focus the agronomist's time.
Farm layout, irrigation, drainage and control-point networks.
Broccoli, Ecuador — lot and drainage redesign based on the topographic profile.
Topography, hydrology, weather and satellite validation cross-referenced with spectral performance.
Hearts of palm, Ecuador — crop response to treatments by zone.
Custom reports for internal teams, investors or certifiers.
Oil palm, Ecuador — lot performance for investment decisions.
All analytics projects are quoted individually.
Book a platform demo or request a quote tailored to your operation.